Die deutsche Fassung dieses Beitrags wird später veröffentlicht.
At the heart of Lean Startup are the Viability experiments. They allow us to save resources by checking the riskiest hypothesis’ first. One thing I’ve seen a lot of companies struggle with is to keep experimenting once they have a successful product running. Assuming these
companies already have a prioritised backlog. Their question could be phased this way:
How should we prioritise an experiment as compared to an item with low risk?
This post aims at exposing the economics behind the experiment in order to create a rule of thumb for prioritising experiments vs. other items.
What is a viability experiment?
There are different definitions of viability experiments and minimal viable products around, so here is what I am speaking about:
Imagine you are running a website selling flights. Your idea: May be your audience — mainly business travellers — is also interested in booking hotels right at the airport just before or after their flight.
You could start negotiating deals with hotels or a hotel provider, which may cost a lot of time and resources. OR, you could test your hypothesis directly. For example you could create a small ad and a button for the hotel offer, show it to a small proportion of your visitors and measure the convergence. People clicking the button would get the message that the service is to be offered soon. If you have high convergence you know there is some interest. But much more probable is that no-one will click it.
This is a typical “Wizard of Oz” -Prototype experiment as described in this book. Or an minimal viable product (MVP) in terms of Eric Ries. Or simply an experiment in terms of Ash Maryua. Coming up with minimal experiments to reduce the risk out of your hypothesis is an art. If you follow the links above you can learn more about it. Another way to learn this art is to hire me :-).
Ordering a typical backlog
Lets assume again you are running this flight search website and your backlog looks something like this:
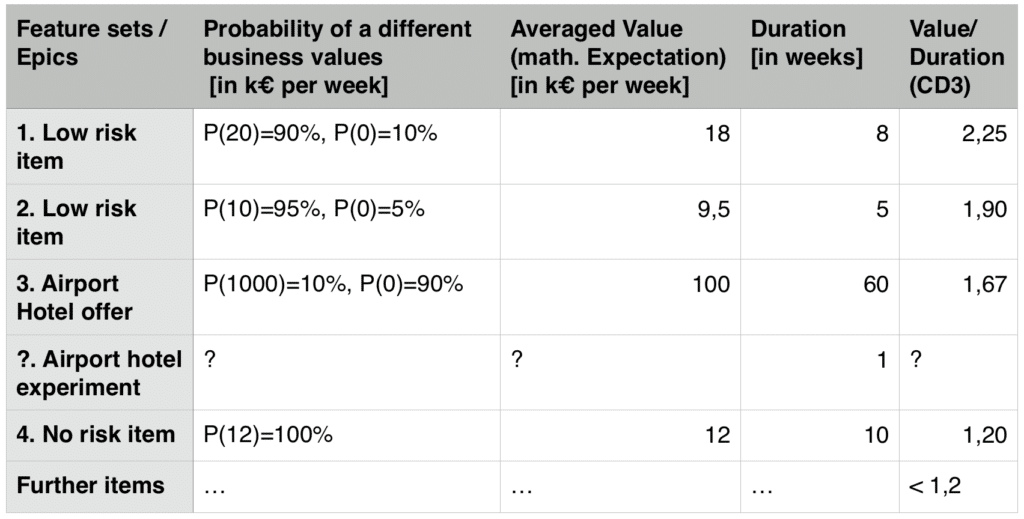
This backlog is already prioritised by maximising the Value/Duration (CD3) ratio. A simple way to see why this is useful is to interpret the different features as ways to boost the money making speed of your product (€/week). By concentrating on highest CD3 you are investing the available resources into the means of higher acceleration. Every feature can be given a “business value” using the concept called Cost of Delay. Here is a post explaining the basics of Cost of Delay.
Lets understand the table above. For each item it shows the probabilities of different outcomes. First item will deliver 20.000€ (or 20k€) per week once implemented with a probability of 90% or with a probability of 10% it will turn out to be useless. In the backlog above we have several low risk items. and the risky Airport hotel offer. The risky item takes a lot of resources to be fully implemented — 60 weeks or more than a year. However it can give us a huge amount of value — 1 million € per week.
Where did I get the values for the probabilities and values? I guessed them. Mainly, in order to explain the matter. However, I believe strongly that by making your assumptions transparent you are inviting others to make their guesses and so start a constructive conversation where everyone can learn from. Lets assume these values where obtained from a discussion of a large group of stakeholders at your company.
How would you deal with this risk
Before we go on, please take 20 seconds to ask yourself two questions:
- What happens to such high risk high value items at the company you are working in?
- Where should we put this experiment item in the backlog as compared to the other low risk items? What does your gut say?
Most companies I see, don’t speak about high risk high value ideas. There is simply no space for them to be discussed. Some companies avoid investing in big risky ideas on purpose, saying that this is for startups only. They prefer buying successful startups over allowing innovation from inside. In other companies, I’ve seen brave managers committing to implementing such ideas completely and risking huge development resources by implementing the whole thing no matter what. One thing for sure, afterwards they have a great story to tell. Using viability experiments is a different way of dealing with this high risk high value ideas.
Cost of Delay of a Viability Experiment
(Disclaimer, IMHO to get a gut feeling it’s useful to understand the mathematics behind it, but you can also simply forward to the final formula)
To derive the value of an experiment I am creating a fictional situation:
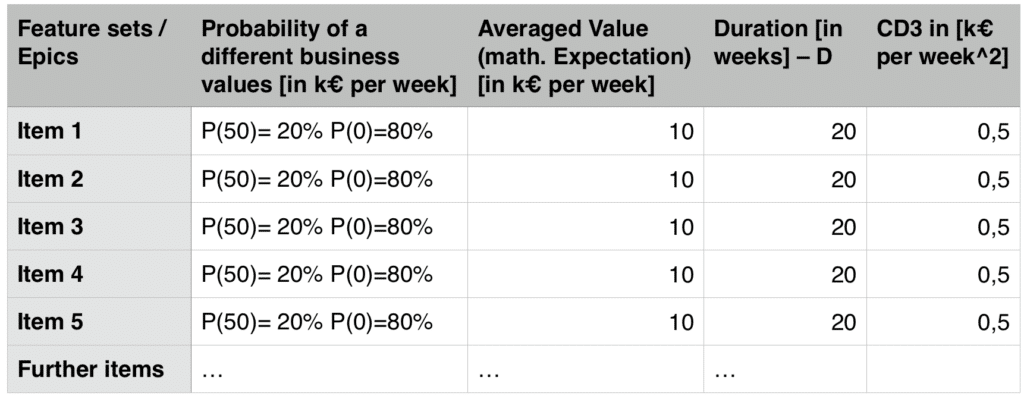
We have backlog, where all items are the same (see below). They all have a Probability p = 20% of successfully delivering some value V = 50 k€/week and take D = 20 weeks to complete. Lets further assume we have resources to run our development organisation our runway R = 120 weeks.
Fictional backlog of items with equal outcome distribution
If we simply invest our runway we can expect the following outcome: We will invest in 6 (120/20) features that will deliver 10 k€/week on average, so 60k€/week. Now with a formula for the expected outcome:

Now, lets introduce the experiments. Each experiment takes a fraction of time (d) to deliver than the feature itself (otherwise why experimenting at all). For example 2 weeks for an experiment instead of 20 weeks for the feature, here d= 10%. To simplify our model further, we assume that the experiment itself does not provide any value to the product but for the additional information it creates. However, after the experiment is run, we know fur sure whether the feature will deliver value or not. This means p (or 20% in our example) is also the probability for the experiment to have a positive outcome.
Please take another moment to check you gut. In this artificial scenario, would you invest 2 weeks to find out your are wrong with 80% probability?
What outcome can we expect to have, if we only do experiments first and build a feature once it has been successfully verified? Well we’ll need on average 5 experiments (100%/20% or 1/p) to have one item verified and then we’ll have to implement the item itself. It means we’ll need 5*2 weeks for experimentation and 20 weeks for implementation. So after spending the runway we can expect to make 120/(5*2+20)*50 = 200k€/week. Or with a formula:

Formula for the expected outcome using experiments before implementing backlog items
Going with experiments first instead of directly implementing the items results in 200k€ /week vs. 60k€ per week. This is equivalent to having invested in backlog items with a CD3 of 3,33 in first place.
This means you would generate more than 3 times the money for your company, if you invested in this experiments that took you 2 weeks and would end with negative learning most of the time instead of investing in the features themselves.
The formula for this proportion is (after some basic simplification):
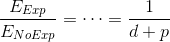
So here it is. The CD3 for a viability experiment is 1/(d+p) multiplied with the CD3 of the feature itself. Surprise, it’s only dependent on the probability of success of the experiment and the duration-ratio of the experiment vs the actual item.
What does this mean?
Lets apply it to our example with the airport hotel experiment:
![]()
Result: this experiment should be the top thing on the backlog. It’s much more valuable than all the other items.
More general, the formula means more risky the experiment (lower p) the higher it’s value. Think about it, this could be counter intuitive. The smaller the probability to actually be successful with your experiment the more valuable that you do it!
And more intuitive: the smaller the fraction of the effort the experiment takes as compared with the items itself the more valuable is the experiment.
Next time you are considering doing an experiment: First find out how much less effort does this experiment mean as compared with the full feature implementation (ask your development team). This is your d.
Second, estimate the probability of a positive outcome of this experiment. This is your p. If p+d < 1, it’s economically sound to do the experiment. When should you do it? Multiply CD3 of your idea with 1/(d+p) and you have the CD3 of your experiment.
What do you think? Did this help you?
PS.: The formula also shows us, how valuable is the art of coming up with experiments and how much more money companies can make by having their people experiment. This needs the skills, but also the freedom to experiment.